Best Visuals for Technical Content and Why They Work
Original Article: Best Visuals for Technical Content and Why They Work
Summary
In this article, I explore the critical role of effective visuals in technical content, advocating for unique and purposeful illustrations over generic stock images. I discuss various types of visuals, highlighting their strengths and why they resonate with readers:
- Infographics: While requiring professional graphic design, they offer unmatched uniqueness, professionalism, and brand identity.
- Stick Figures: These are simple, engaging, and highly effective for conveying concepts humorously, making them memorable and shareable for social media promotion.
- Sketch Notes: They create a strong personal connection and make complex ideas more approachable, akin to personal study notes.
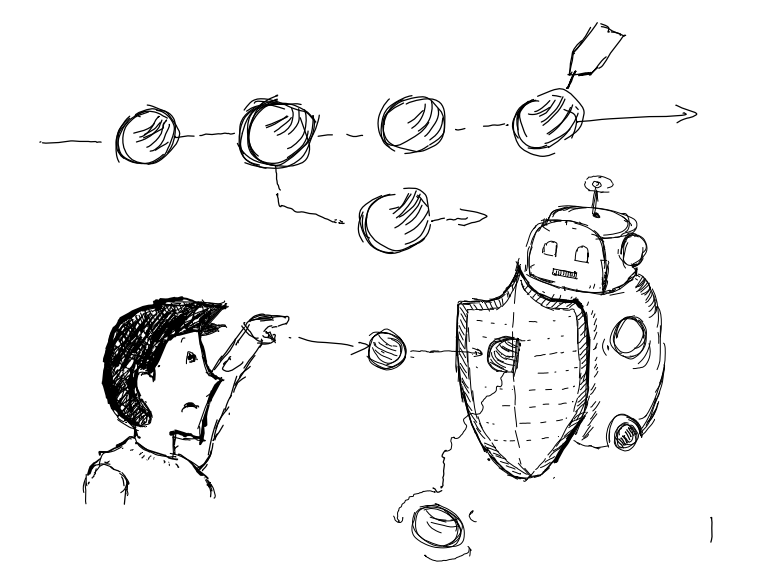
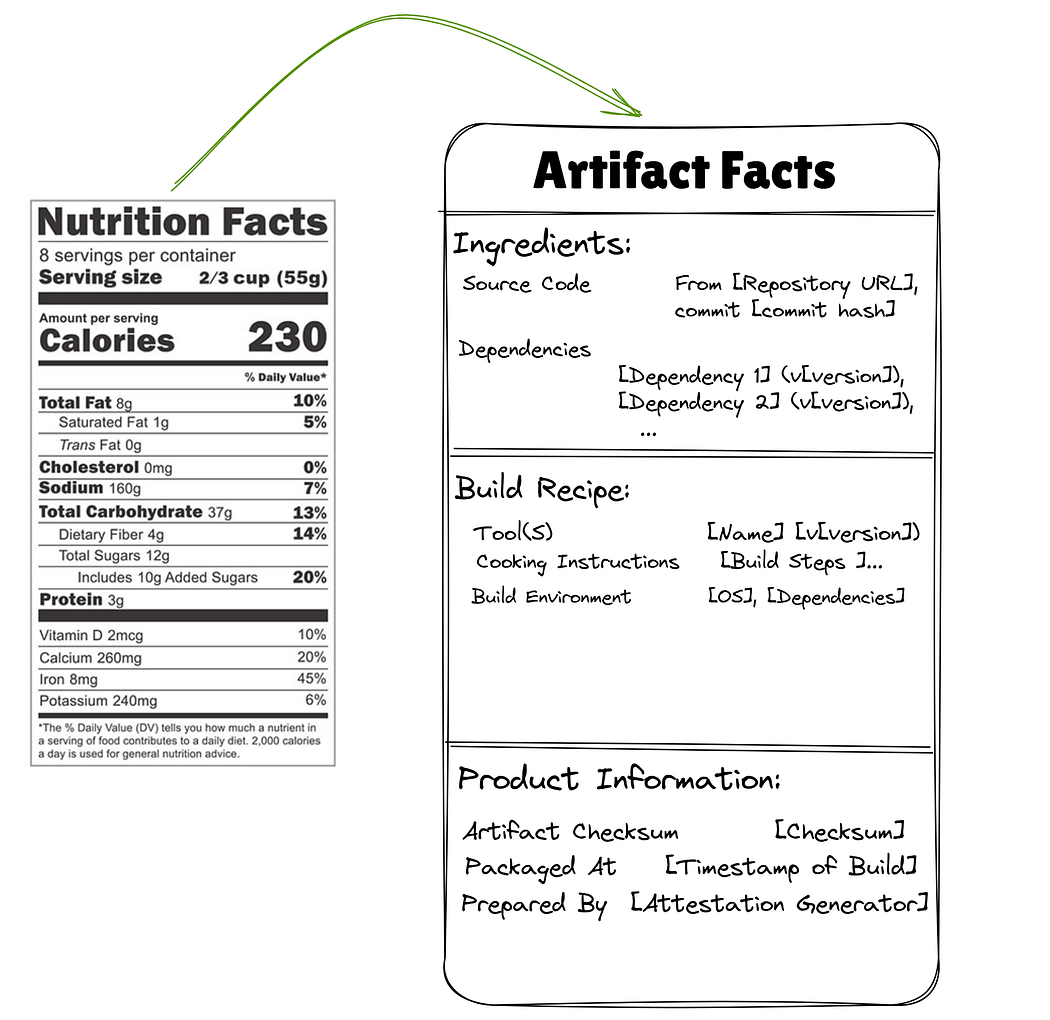
- Hand-Drawn Illustrations: Ideal for building a personal brand, these visuals convey creativity and simplify intricate processes with an immediate visual impact.
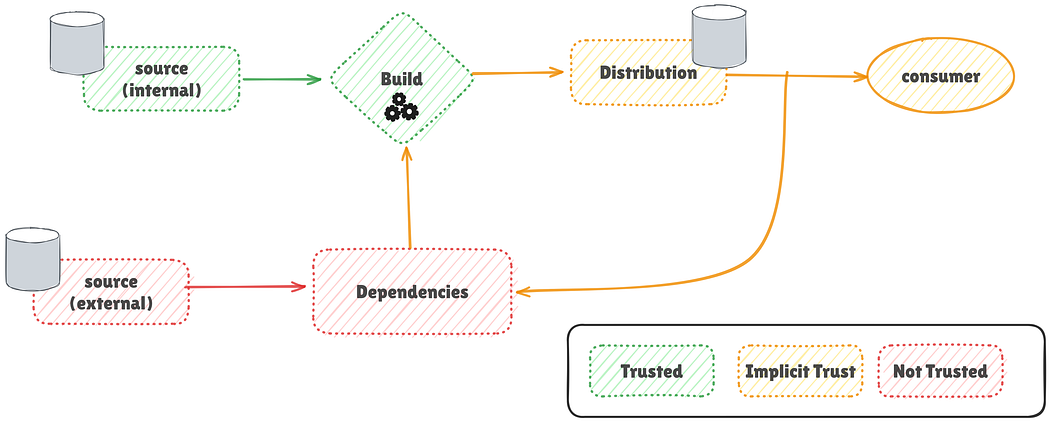
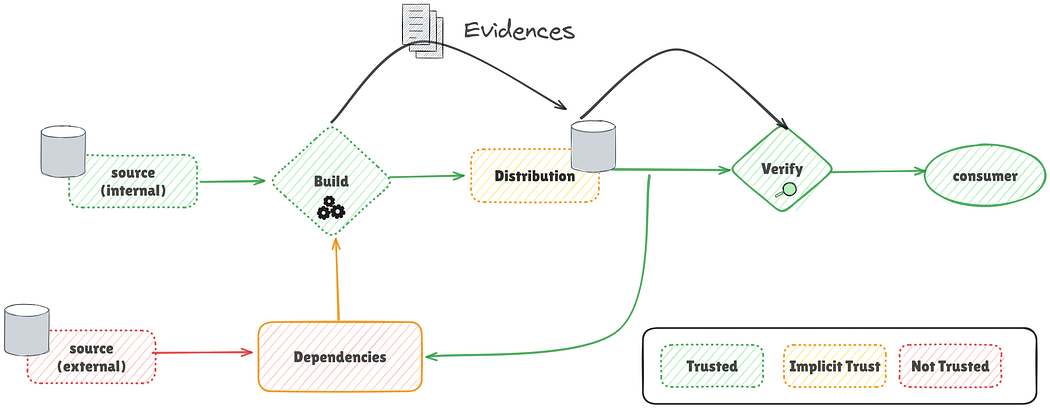
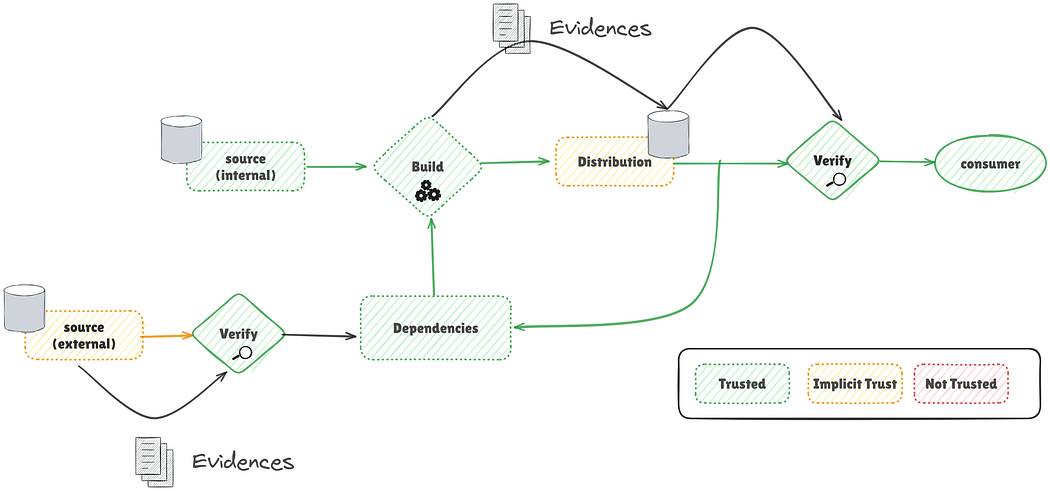
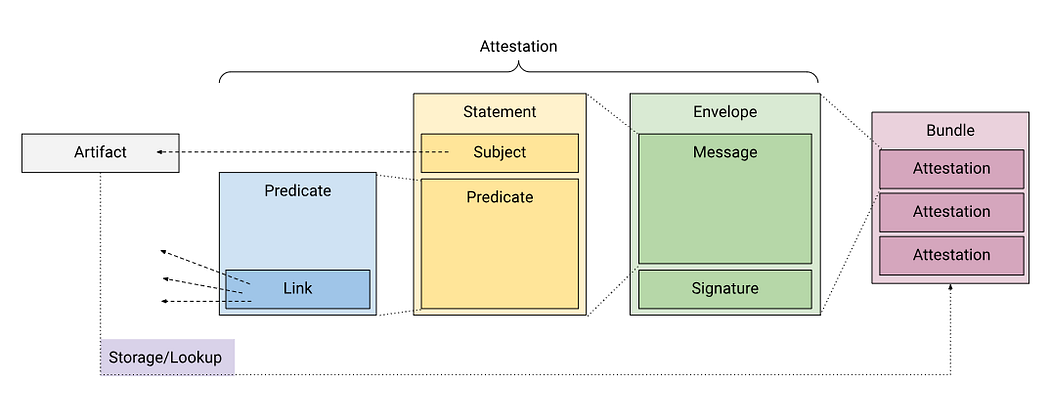
- Box and Arrow Diagrams: These combine clarity, information, and a touch of creativity, proving excellent for illustrating system designs and architectural concepts.
- Flowcharts, UML, and Sequence Diagrams: As structured and professional tools, these are perfect for conveying precise technical information and are easily maintainable through code.
I recommend that you, as a technical writer or content creator, consider starting with more structured diagrams if you lack artistic experience, gradually moving towards more creative visual styles as your confidence and skills develop. The ultimate goal is always to ensure your visuals accurately reflect your content and enhance reader comprehension and engagement.
Popular Tools and Resources
The article highlights several tools for creating these visuals:
Hand-Drawn (digital)
- Sketchbook
- Procreate
- Adobe Fresco / Adobe Draw
Box and Arrows
- Excalidraw
- Draw.io
Flowcharts, UML diagrams, etc.
- Plantuml
- Mermaid
References

My name is